The GLS

WHALE
SYSTEM

See where the big money is buying and selling on NQ, ES and gold — drawn on your TradingView chart while the candle is still forming.

  • Thick whale lines mark the biggest buy and sell prints, live.
  • Buyers absorbed / sellers absorbed tags tell you who got trapped.
  • Stop and target lines drawn for you the moment a whale prints.
  • Loud whale alerts on NQ, MNQ, ES and gold so you don't have to stare at the chart.
Exclusive · Next 30 Days

Get the full system — both indicators + the Whale System + the live group — for $150/mo. Lock it in now; the price goes up next month.

Get the Whale System — $150/mo

Futures trading involves substantial risk. Past results don't guarantee future results. Educational tool, not financial advice.

MNQ · 15m
Example chart for illustration.
⚡
Requires TradingView Premium

The Whale System reads real-time volume to catch prints as they happen. To get live data you must upgrade your TradingView plan to Premium — on the free plan the feed is delayed and whales show up late.

Upgrade TradingView →
How it works

The tape, read for you

Big institutions can't hide size — when they fire, it prints. The Whale System watches every bar for those prints, measures the delta behind them, and draws the whole plan on your chart the instant it happens. Here's every piece.

01 · Whale prints

See the big money hit — live

Every time an outsized order prints, a thick line drops on your chart with the size and the net delta behind it. Green when buyers are lifting, red when sellers are hitting. You see who's actually in control, not what the candle color says.

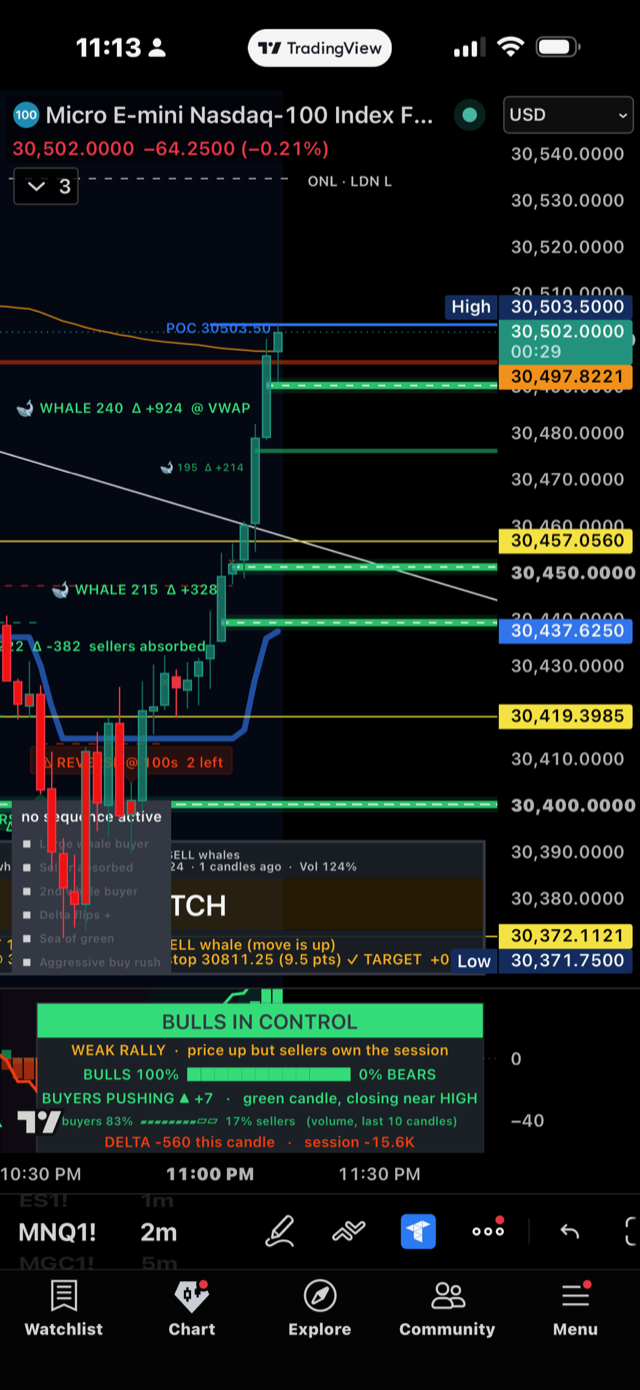
  • WHALE 240 · Δ +924 @ VWAP — a buy whale, 924 net contracts to the upside
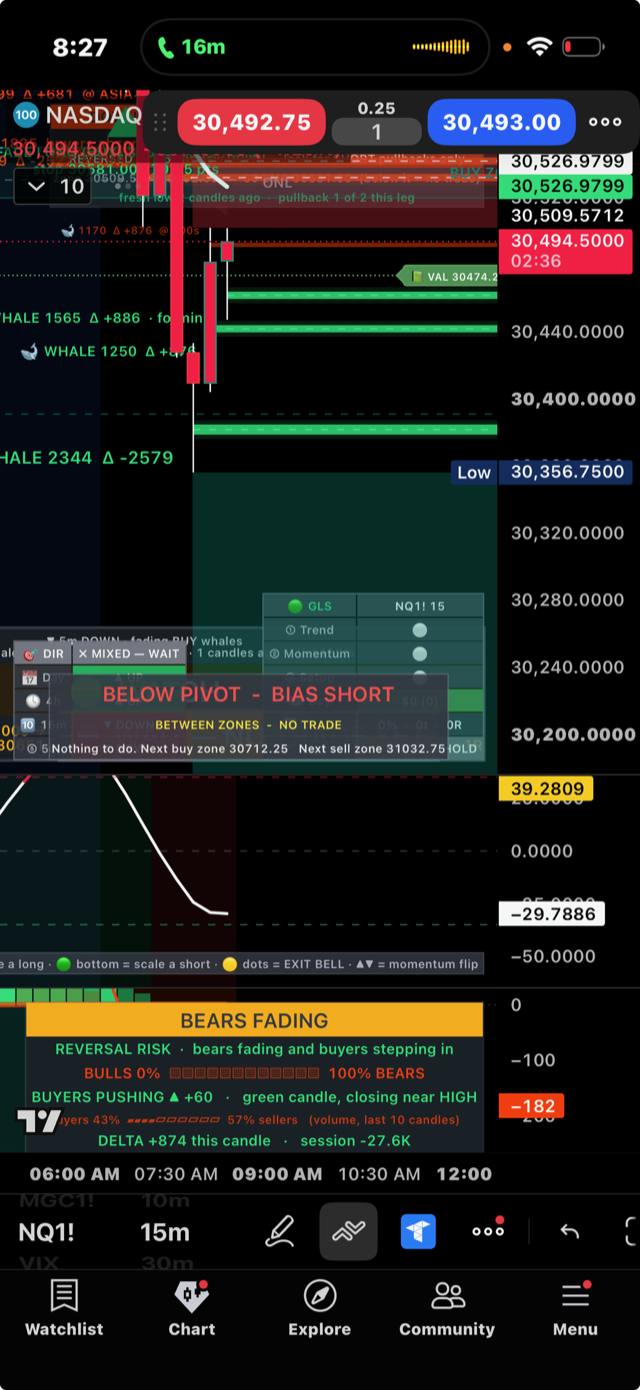
  • WHALE 2344 · Δ −2579 — a sell whale dumping into the bid
  • Tagged at the exact level it fired — VWAP, POC, session highs/lows
NQ · 2m — buy whale at VWAP
Example chart for illustration.
02 · Absorbed

Know who got trapped

The most important tell on the tape: a big order fires and price doesn't move. That means the other side ate it. "Sellers absorbed" means sellers hit the bid and buyers soaked it all up — fuel for a move up. The system flags it the second it happens.

  • Sellers absorbed — sell pressure got eaten → look up
  • Buyers absorbed — buy pressure got eaten → look down
  • Catches the trap before the reversal, not after
MNQ · 2m — sellers absorbed, reversal up
Example chart for illustration.
03 · Stop & target

The plan is drawn for you

The moment a whale prints a tradeable setup, the system draws the stop and the target right on the chart — with the risk in points and the reward in R. No measuring, no guessing. You either take the plan or you don't.

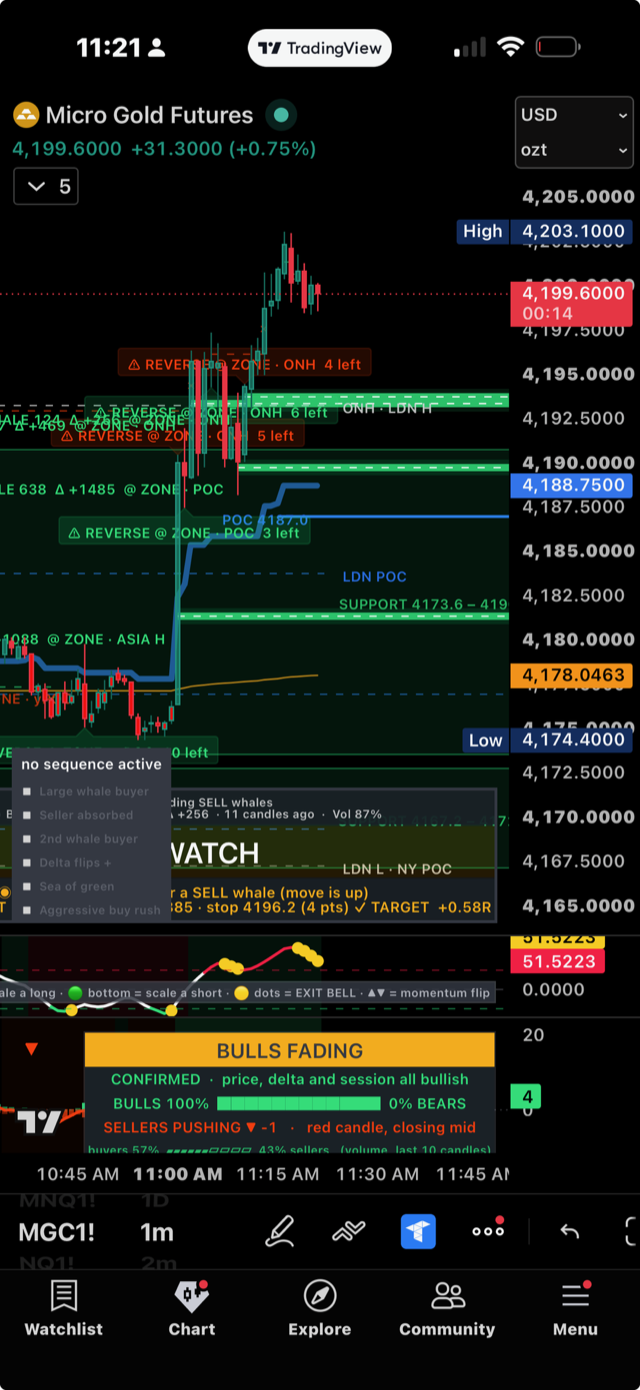
  • Stop 4196.2 (4 pts) — exact invalidation, drawn in red
  • ✓ Target +0.58R — reward mapped against your risk
  • Whale level becomes your line in the sand
Gold · 1m — whale at POC, stop + target set
Example chart for illustration.
04 · Control panel

Who owns the session, right now

A plain-English regime readout sits on your chart at all times: are bulls or bears in control, is it confirmed or fading, and what the delta says about this exact candle. No indicator soup to interpret — it tells you.

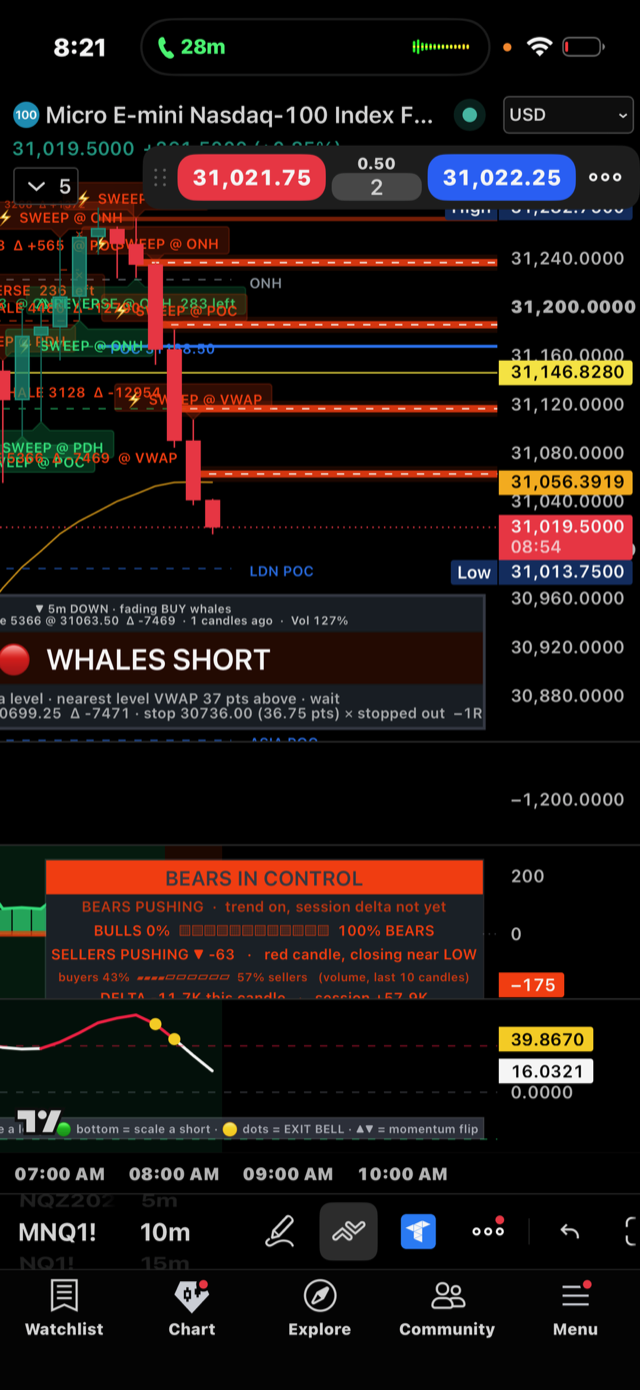
  • BULLS / BEARS IN CONTROL — the current regime
  • CONFIRMED vs FADING — is it strengthening or rolling over
  • Buyers vs sellers % over the last 10 candles
BULLS IN CONTROL
CONFIRMEDprice, delta & session all bullish
BULLS 100%0% BEARS
BUYERS PUSHING ▲ +27closing near HIGH
buyers 58%42% sellers
DELTA +3.1K this candle · session +36.2K
05 · The setup sequence

A checklist, not a guess

The A+ long isn't one signal — it's a sequence. The system tracks each step and only greenlights when the story is complete, so you're not front-running half a setup. When the boxes fill, it fires the call.

  • Watches the whole sequence, step by step
  • LEAN LONG / BIAS SHORT / WAIT — tells you the posture
  • Nothing to do when there's no edge — no overtrading

Long sequence

example — fires when every step confirms
  1. Large whale buyer prints
  2. Seller absorbed into the move
  3. 2nd whale buyer confirms
  4. Delta flips +
  5. Sea of green — tape turns
  6. Aggressive buy rush
● LEAN LONG — buy whale + seller absorbed · target mapped
06 · Dashboard & alerts

One glance. Then an alert does the staring.

The GLS dashboard stacks the whole picture — trend, momentum, setup, regime and your day — across timeframes in one corner. And when a whale fires, a loud alert hits your phone. You don't have to watch the chart; the chart watches for you.

  • Trend · Momentum · Setup · Regime at a glance
  • Loud whale alerts on NQ, MNQ, ES & gold
  • Exit-bell dots and momentum-flip markers on the lower pane
GLSNQ1! · 15m
① TrendUP
② MomentumUP
③ Setupforming
④ RegimeTREND ↑ — HOLD
Day+2R
Caught live

Real whale prints, real sessions

Straight off the chart — buy and sell whales firing on NQ, MNQ and gold, with the deltas, the absorbed tags, and the stop/target the system drew in real time.
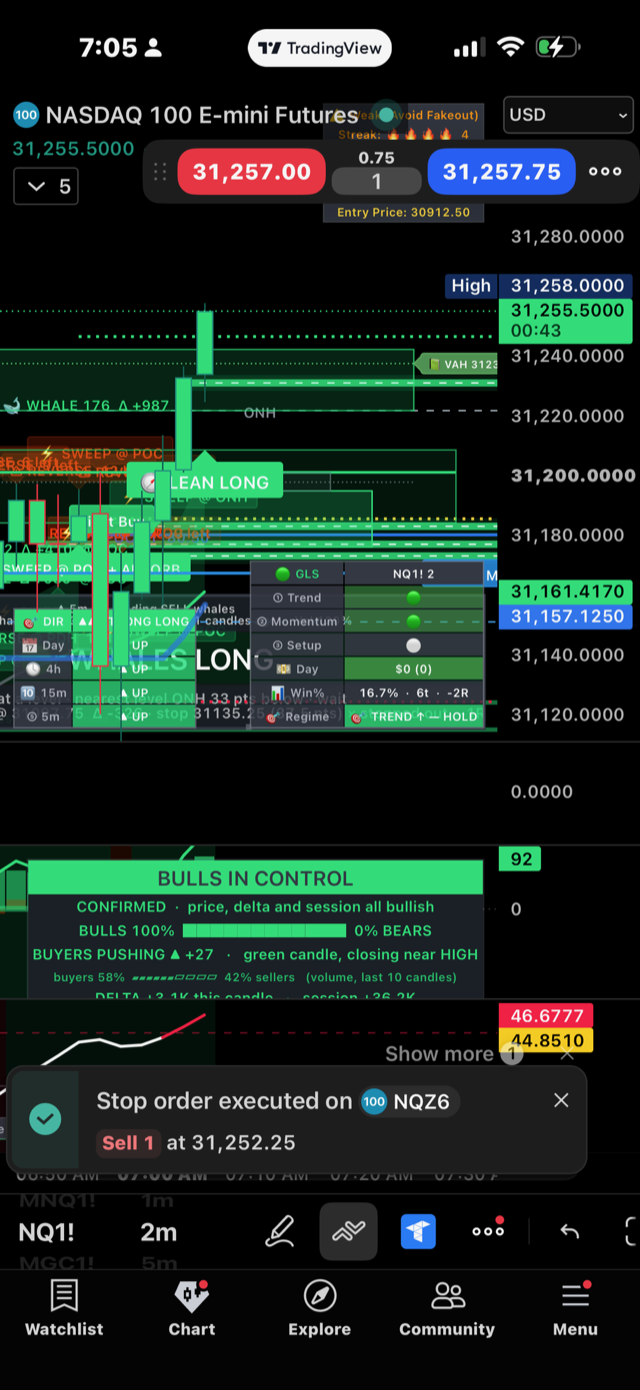
GLS Whale System on NQ: whale buy, lean long, order executed
NQ · whale +987 → LEAN LONG · order filled
GLS Whale System on MNQ: buy whale at VWAP, sellers absorbed
MNQ · whale +924 @ VWAP · sellers absorbed
GLS Whale System on gold: whale at POC with stop and target
Gold · whale +1,485 @ POC · target set
GLS Whale System on MNQ: whales short, bears in control
MNQ · whales short · bears in control
GLS Whale System on NQ: sell whale, below pivot bias short
NQ · whale −2,579 · bias short
Live screenshots · for illustration, not a promise of profit
Exclusive · Next 30 Days Only

Get the Whale System

$150/mo

Lock the full system in at $150/mo for the next 30 days. Next month the price goes up — this rate is only here now.

  • The Whale System — prints, absorbed tags, stop & target, alerts
  • Both GLS indicators — when to get in and when to get out
  • The live Telegram group + the full free course
Lock In $150/mo →
Requires TradingView Premium for live data · Invite-only · Cancel anytime · Price increases next month